
Protocol
Control the evaluation conditions before interpreting variation.
Sample preparation, presentation, timing and recording practices shape the evidence available to an evaluator and should be explicit.
Sensory & Quality · Evaluation
Professional sensory evaluation requires controlled conditions, independent observation, repeatability, comparison and a clear connection between what is perceived and what decision follows.
Evaluation in practice
Sensory evaluation is a physical measurement practice, not only a scoring interface.
Cups, spoons, samples, references and written observations create the environment in which structured sensory decisions are made.
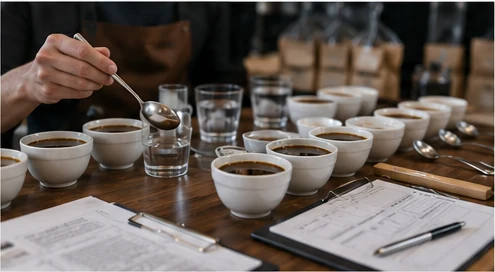
Structured sensory evaluation combines observation, comparison, documentation and calibration.
Evaluation architecture
The evaluation system should make the source of variation visible instead of collapsing every observation immediately into one final score.
Sample preparation, presentation, timing and recording practices shape the evidence available to an evaluator and should be explicit.
Independent observations preserve genuine differences and reduce immediate social convergence during professional comparison.
Repeated presentations and evaluator-level records help identify whether variation comes from within a person, between people or another condition.
Evaluation becomes useful when observations are connected to purchasing, roasting, QC, product development, training or another defined decision.
Controlled preparation and independent observations create the basis for comparison, calibration and discussion.
Structured evaluation
The demonstration tool provides a compact example of how sensory observations can be separated and organized before interpretation.
Interactive evaluation workflow
Explore five stages of structured coffee evaluation. Each stage asks a different question and produces a different kind of evidence.
01 / 05
Notice what is present before deciding what it means. Structured observation separates perception from interpretation.
Educational workflow only. It illustrates structured evaluation thinking; it is not an official scoring form or competition judging system.
State and interpretation
Interactive models are explanatory interfaces. They do not replace measured sensory data or professional evaluation.
Spatial coffee model
This isolated model demonstrates where a true 3D tool can add visual value. It is intentionally lazy-loaded and does not turn the rest of SZ Coffee into a WebGL application.
Evidence architecture
This scientific figure separates observation, comparison and interpretation. Demonstration values are explicitly identified and should not be read as measured coffee results.
Comparative sensory evidence
Demonstration values illustrate how two sensory profiles can differ without implying that either profile represents higher coffee quality.
Advanced sensory workspace
Open the workspace mode needed for the current decision. Each tool keeps its existing analytical behavior while the page presents less simultaneous cognitive load.
Professional sensory reasoning
Compare sensory observations without collapsing intensity, preference and quality into the same judgment.
Start with two conceptual samples without process, origin or quality information. Compare only the sensory evidence.
Selected observation
Describe perceived aromatic intensity before naming quality or preference.
Evidence
Describe the difference before explaining it.Sample values describe perceived intensity. They do not establish preference, defect, roast causality or overall quality.
A higher value means stronger perceived intensity in this exercise. It does not mean that the coffee is better.
Calibration Intelligence v4
Explore directional deviation, attribute-level agreement and overall calibration pattern without converting the result into a coffee quality score.
Pattern interpretation
aroma has the largest deviation in this trial.The deviations are mixed or broadly balanced rather than consistently directional.
Professional calibration analytics
Demonstration evaluator data is compared with a shared conceptual reference. These outputs illustrate analytical structure and are not official SCA calibration thresholds.
| Evaluator | Mean signed deviation | Mean absolute deviation | Repeatability difference | Agreement index |
|---|---|---|---|---|
| E01 | -0.3 pts | 0.7 pts | 1 pts | 99.3% |
| E02 | 2.7 pts | 2.7 pts | 1 pts | 97.3% |
| E03 | -3.9 pts | 3.9 pts | 1 pts | 96.1% |
| E04 | 0 pts | 0.4 pts | 0.8 pts | 99.6% |
Reference + repeat comparison
Reference deviation describes proximity to the dataset reference. Repeatability describes difference between repeated observations. Neither measure alone establishes evaluator competence or coffee quality.
| Evaluator | Trials | Signed deviation | Absolute deviation | Repeat difference | Largest repeat difference |
|---|---|---|---|---|---|
| E04 | 2 | 0 pts | 0.4 pts | 0.8 pts | 1 pts |
| E01 | 2 | -0.3 pts | 0.7 pts | 1 pts | 1 pts |
| E02 | 2 | +2.7 pts | 2.7 pts | 1 pts | 1 pts |
| E03 | 2 | -3.9 pts | 3.9 pts | 1 pts | 1 pts |
Dataset ingestion
Import CSV or JSON locally in your browser. Files are parsed and validated in the current session and are not automatically uploaded, published or persisted.
id, lotId, sessionId, evaluatorId, sequence, attribute, valueid, evaluatorId, repeat, aroma, acidity, sweetness, body, aftertasteNo local dataset loaded.
From evidence to action
Evaluation systems can connect with cupping calibration, sensory education, quality control, roasting and product decisions.
Discuss sensory evaluation